This is going to be the final part in the Distributed Tracing series using Jaeger in a Spring Boot application. So far, we covered overview on Distributed Tracing and how we can integrate tracing using Jaeger in our Spring Boot applications. If you are coming to this post directly, I will urge you to go through the previous parts on this topic on this blog:
In this final part I will be wrapping up with the basic concepts that I had targeted to cover in the whole Distributed Tracing series.
🎯 What happens under the hood?
In the sample applications that we had developed, we included a jaeger dependency. This instrumented our code for distributed tracing. The Jaeger UI is the tool, which we ran via the easiest way using Docker, collected the metrics and other data from our application code and gave that a meaning through visual representations in the UI.
So clearly as far distributed tracing is concerned, we have two key components involved here:
- The first component is the one which instrumented our code. Gathered information from our code and pushed to a destination.
- The second component is the tracer UI which obtained data sent by the instrumentor piece and used that to represent transaction life span in its UI. We had used Jaeger UI for this.
The first component here, the instrumentor piece, is an implementation of OpenTracing specification.
OpenTracing is a vendor neutral open standard for distributed tracing. It provides model and interfaces that will be used for instrumenting the code. We used Jaeger implementation for OpenTracing in our applications.
With this approach, we are not tied to a particular backend implementation. We can easily switch to another implementations.
But did we write any code specifically in our applications to instrument the code ourselves, like creating traces and span, and then push the context propagation further? The answer is no, we did not do that.
We could have controlled everything, from creating traces to individual spans and tie the parent child relationships, but all these were not required explicitly as we had used opentracing-spring-jaeger-web-starter.
This implementation does more than providing the mere implementation. It automatically creates traces and spans as the request executes in the pipeline. And like I mentioned in part 2 as well, the Jaeger implementation here is:
- Instrumenting the code
- Intercepting the service calls that happen from their host application and insert proper header information.
- Passing the updated header to the next service call in the pipeline as part of context propagation.
- During service calls, it extracts the information from header and process it, and then after updating the header passes on to the next service call in the pipeline.
Well yes, opentracing-spring-jaeger-web-starter does this all on its own by default.
But what if we need to manually trigger the creating of trace, and add spans to it?
🎯 Creating tracing information manually
So in case of service calls we understood that Jaeger implementation used here is smart enough to do the instrumentation on its own. But if the application needs to do something on its own, without invocation from any service calls, then how do we manage that?
For example, consider an application which offers set of web services to be used by different clients. And this application also needs to send heartbeat to a destination saying that its alive, every 1 minute. So this thing needs to be invoked without any service call. We will see and learn how can we add traces manually.
I am implementing this is initiator-service.
package nerd.utopian.initiator.service;

import io.opentracing.Span;
import io.opentracing.Tracer;
import org.slf4j.Logger;
import org.slf4j.LoggerFactory;

import java.util.TimerTask;

public class IAmAliveTimerTask extends TimerTask {

    private static final Logger LOGGER = LoggerFactory.getLogger(IAmAliveTimerTask.class);

    private Tracer tracer;

    public IAmAliveTimerTask(Tracer tracer) {
        this.tracer = tracer;
    }

    @Override
    public void run() {

        // creating a new span.
        Span span = tracer.buildSpan("iam-alive").start();

        // marking the span as child of...
        Span activeSpan = tracer.buildSpan("iam-alive-call").asChildOf(span).start();

        LOGGER.info("initiator-service is alive");

        activeSpan.finish();
    }
}
I have used TimerTask for this example. Using TimerTask I have scheduled this service to run every 1 minute, and create a log entry mentioning that the service is alive.
I tied this custom TimerTask class to get triggered in a service class like below:
package nerd.utopian.initiator.service;

import static java.util.Objects.requireNonNull;

import io.jaegertracing.internal.JaegerTracer;
import java.util.Timer;
import java.util.TimerTask;
import javax.annotation.PostConstruct;
import org.slf4j.Logger;
import org.slf4j.LoggerFactory;
import org.springframework.stereotype.Service;

@Service
public class IAmAliveService {

  private static final Logger LOGGER = LoggerFactory.getLogger(IAmAliveService.class);

  private JaegerTracer jaegerTracer;

  public IAmAliveService(JaegerTracer jaegerTracer) {
    this.jaegerTracer = requireNonNull(jaegerTracer, "jaegerTracer is required but is missing");
  }

  @PostConstruct
  public void isAliveService() {

    TimerTask timerTask = new IAmAliveTimerTask(jaegerTracer);

    // running timer task as daemon thread
    Timer isAliveTimer = new Timer(true);

    // will execute every 1 minute.
    isAliveTimer.scheduleAtFixedRate(timerTask, 0, 60 * 1000);

    LOGGER.info("isAliveService started...");
  }
}
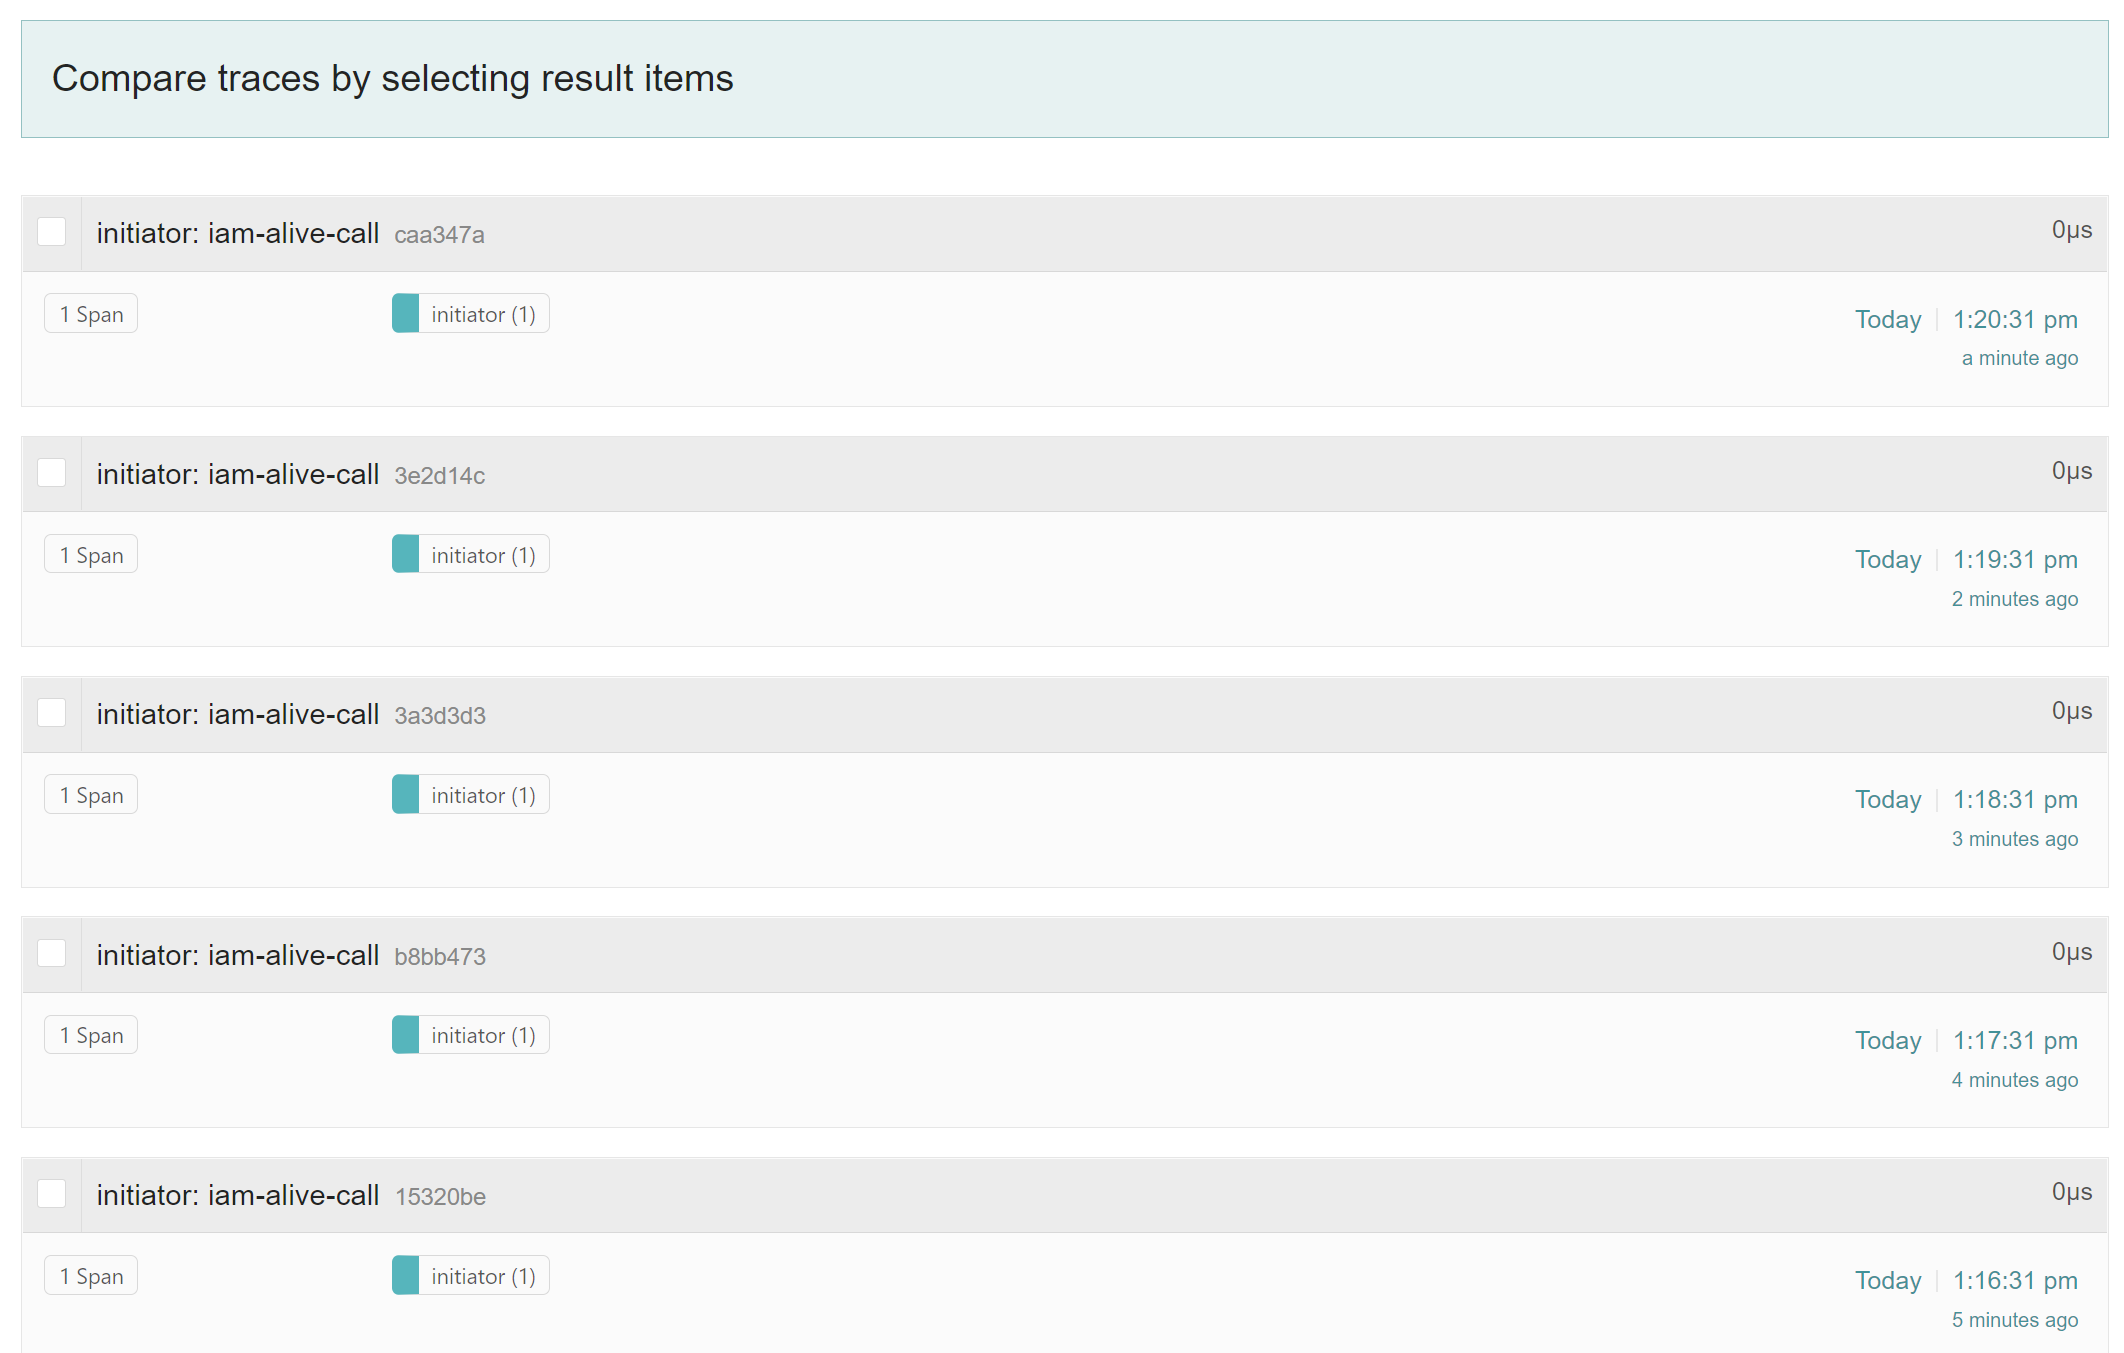
Let’s run the application and see what we are getting in the logs and in the Jaeger UI.
Console:

Jaeger UI:

In this example I tried to show how can we create trace and add spans to it manually.
If we had to add trace information to header manually for context propagation, we would do something like below:
Request.Builder requestBuilder = new Request.Builder().url(serviceUrl);

tracer.inject(
    tracer.activeSpan().context(),
    Format.Builtin.HTTP_HEADERS,
    new RequestBuilderCarrier(requestBuilder));
.
.
.
.
To extract the information from header in the next service call, we would do something like below:
SpanContext parentContext = tracer.extract(Format.Builtin.HTTP_HEADERS, new TextMapExtractAdapter(headers.toSingleValueMap()));
Span span = tracer.buildSpan("orchestrator").asChildOf(parentContext).start();
🎯 Ending Notes
I hope this post would have helped you in one way or the other. All the code changes that I did in this post are present at my GitHub repository. If you have any suggestions for me, then please share that with me by commenting below.